Bloggers: how often to look at your traffic numbers? What do you look for? Do you ever take a deeper dive to determine cause and effect? Do you notice trends? I just did that… well, for a very specific reason.
A blog post I wrote way back in 2009 started the trend I’m about to share. In fact, this trend resulted in a second blog post in 2011.
Why all the traffic? Simple. Most of us hate telemarketer calls and worse yet, those calls happen to come during the dinner hour when we’re all resting after a long day.
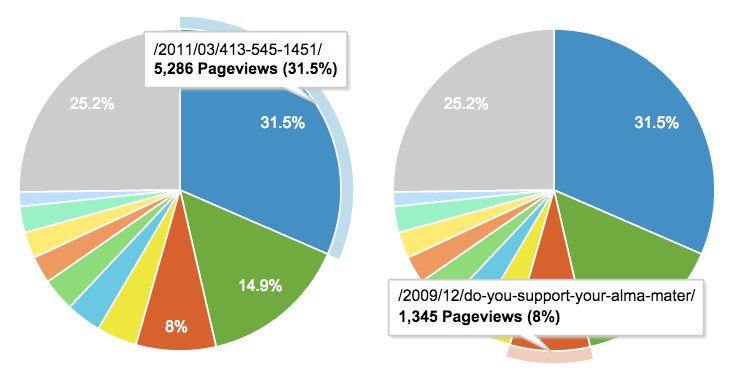
So, since that 2009 blog post, this site has been getting a fair amount of traffic from folks who are Googling a very specific phone number: 413-545-1451.
Outside of the dinner hour or prime time TV hours, this number on your Caller ID screen is fairly innocuous. It shows up whenever someone from the UMass Amherst campus calls from a campus phone. Simple. Common to companies or organizations with large phone networks that haven’t updated their telephony to display the actual user’s extension.
Anyway, since 2009, these two blog posts account for 39.5% of traffic to this site.

Pretty neat, eh? I guess you could call it a public service from this alum to his alma mater.
In fact, drilling down to a weekly or monthly view shows a rough average of 10-15% of traffic.
So as we get into a particularly “busy” time of year for telemarketers and pollsters ahead of the election and holidays, don’t lump these calls into an otherwise deserved impulse to hang up.
The students on the other end of the line are amongst the proudest you’ll encounter. They’ll offer a good story and hopefully you’ll be motivated to give.